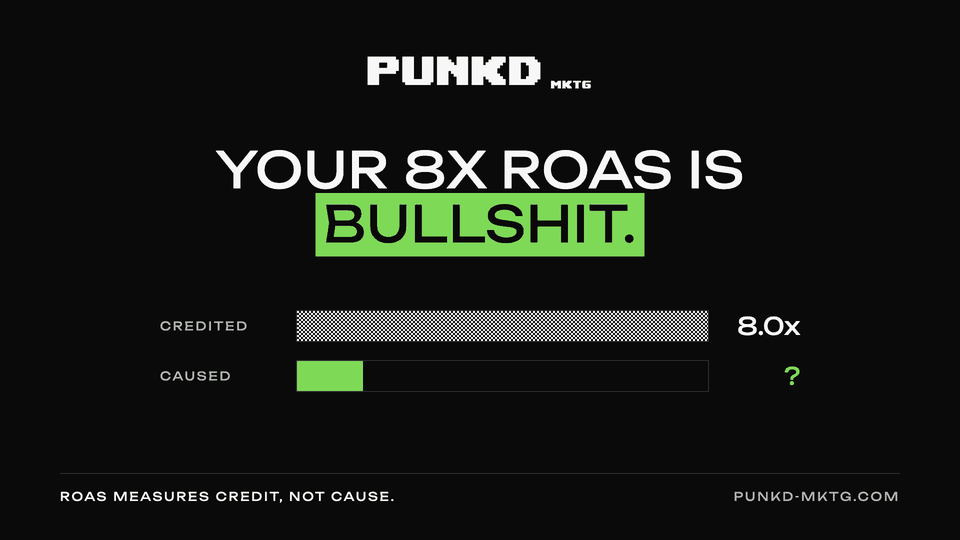
Your 8x ROAS is bullshit (and your ad platform knows it)
TL;DRAt a glance
- ROAS counts the sales your ads got credit for, not the sales your ads caused.
- The counting is done by Meta, Google and TikTok: the same companies selling you the ads.
- eBay, Uber and Airbnb cut ads and lost little or nothing: a lot of "ad revenue" was coming anyway.
- The highest ROAS hides in brand search, retargeting and coupon sites, which reach people who were already buying.
- Break-even ROAS = 1 ÷ your margin. At a 30% margin, a "good" 3x loses you money.
- Measure incremental revenue (with a holdout test), profit after ad spend, blended ROAS and cost per new customer instead.
ROAS tells you how many sales your ads got credit for. It does not tell you how many sales your ads caused.
Those are two different numbers, and most brands set their budgets on the wrong one. Below: the proof, the maths, and what to measure instead.
WHAT ROAS ACTUALLY MEASURES
ROAS (return on ad spend) = revenue credited to your ads ÷ what you spent on them.
The word that matters is "credited". If someone saw or clicked your ad before buying, the platform gives the ad credit for the sale. That is called attribution. It never asks the one question that matters: would this person have bought anyway?
And who does the counting? Meta, Google, TikTok. The same companies selling you the ads.
THREE COMPANIES THAT SWITCHED THEIR ADS OFF TO CHECK
eBay turned off paid search in 68 US markets for 60 days and compared sales with the markets where ads kept running. Ads on searches for its own name had no measurable short-term effect on sales. On other keywords, ads did bring in new and occasional shoppers, but most of the money went on regular customers who were buying anyway. Average return: negative.
Uber cut about $100 million from an ad budget of roughly $150 million. Rider sign-ups did not drop. Fraudulent ad networks had been claiming credit for people who found the app on their own.
Airbnb cut its overall marketing spend by 50%, and its traffic stayed around 2019 levels. By 2022, nearly 90% of its traffic was direct.
The lesson: a big share of "ad revenue" does not disappear when the ads do. It was never coming from the ads.
WHERE FAKE ROAS HIDES
The highest ROAS numbers usually come from three places:
- Brand search: people searching your brand name. They were already looking for you.
- Retargeting: people who already visited your site or left something in their cart. Many were going to buy anyway.
- Coupon and cashback sites: the code gets used by people who were already at checkout.
All three reach people who have already decided to buy. That is harvesting demand, and dashboards love that shit because it converts beautifully.
Ads that reach new people (prospecting) show a lower ROAS, because people who do not know you yet take longer to buy. So they get cut first. Then growth stalls, and everyone blames the algorithm.
ROAS IGNORES YOUR MARGIN
ROAS counts revenue, not profit. To know whether an ad makes money, you need your break-even ROAS:
Break-even ROAS = 1 ÷ your margin (after product cost, shipping, returns and payment fees)
- 50% margin: break-even at 2x
- 40% margin: break-even at 2.5x
- 30% margin: break-even at 3.33x
- 20% margin: break-even at 5x
Example: you spend $1,000 and get a 3x ROAS, so $3,000 in sales. At a 30% margin, those sales leave you $900 before ads. Take away the $1,000 ad bill and you lost $100. On a "good" 3x.
EVEN META IS ADMITTING IT
In 2025 Meta added incremental attribution to Ads Manager: a setting that tries to separate the sales your ads caused from the ones that would have happened anyway.
When the company selling the ads builds a tool to check whether the ads worked, take the hint.
WHAT TO MEASURE INSTEAD
Incremental revenue: sales that only happened because of the ad. You find it with a holdout test. Hide your ads from one group (a few cities, or a random slice of your audience), keep showing them to everyone else, and compare sales. The difference is what your ads really did.
Profit after ad spend: the margin on your sales minus the ad bill. If this number is not growing, your ROAS does not matter.
Blended ROAS (also called MER): total revenue ÷ total marketing spend, both taken from your own books, not from the ad platforms. Nobody can double count it.
Cost per new customer: judge prospecting ads on how cheaply they bring in people who have never bought from you.
THE PUNKD TAKE
A high ROAS is not proof you are winning. Usually it is proof you are playing scared, spending on people who were already sold.
Real growth looks worse in a dashboard. New customers cost more than returning ones, so when you push into new audiences your ROAS drops. Relax, nothing is broken: you are finally reaching people who did not know you existed.
We have managed $3.5M+ in ad spend on Meta and Google since 2023, and we typically find 18-30% of ad spend doing nothing at all. So the fix is rarely spending less. Move that money to what actually causes sales, then scale the hell out of it.
STEAL THIS
- Work out your break-even ROAS: 1 ÷ your real margin. Any campaign below it is losing money.
- Add up the revenue Meta, Google and every other platform claim, and compare it with your actual revenue. If they claim more than you made, they are counting the same sales twice.
- Run a holdout on brand search: pause it in a few cities for two weeks and watch total revenue, not platform revenue.
- Split your reporting into prospecting, retargeting and brand. Judge prospecting on cost per new customer.
- Run one Meta campaign on incremental attribution next to your normal setup and compare the two numbers.
THE SHORT VERSION
- ROAS measures credit, not cause.
- The highest ROAS usually comes from people who were buying anyway.
- A "good" ROAS can still lose money if it sits below your break-even.
- Measure incremental revenue and profit after ad spend instead.
If you switched off your best-ROAS campaign tomorrow, how much revenue would actually disappear?
Most brands are quietly overpaying for customers they already had, and almost nobody checks. We check.
Book Free ConsultationSources
- https://www.nber.org/papers/w20171
- https://newsroom.haas.berkeley.edu/study-finds-paid-search-ads-dont-always-pay/
- https://thehustle.co/01072021-uber-ad-spend
- https://www.marketingweek.com/airbnb-performance-marketing/
- https://www.marketingweek.com/airbnb-cfo-performance-brand/
- https://www.threechaptermedia.com/blog/incremental-attribution-guide-2026